Proposed Tax Increase Accomplished with Lower Millage
The proposed 2023 PBG Budget raises about $7.8M in new taxes, up a 10.9% over last year’s adopted budget. See the Proposed Budget here.
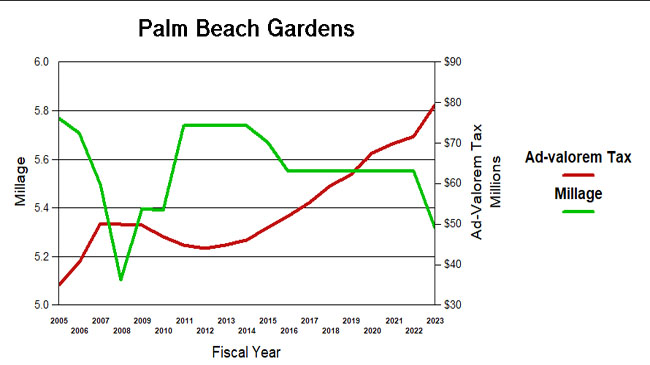
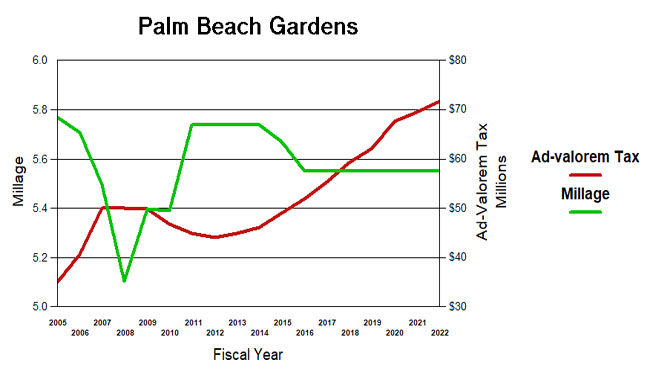
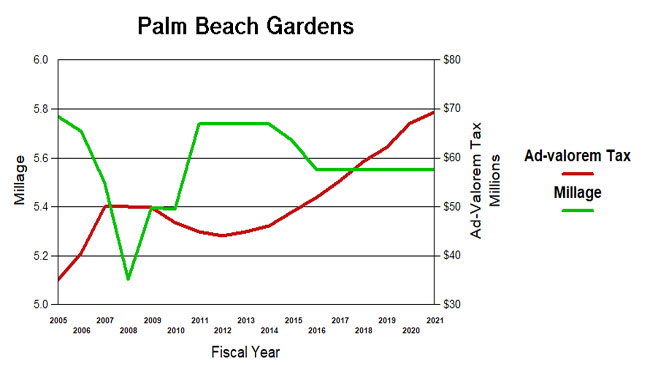
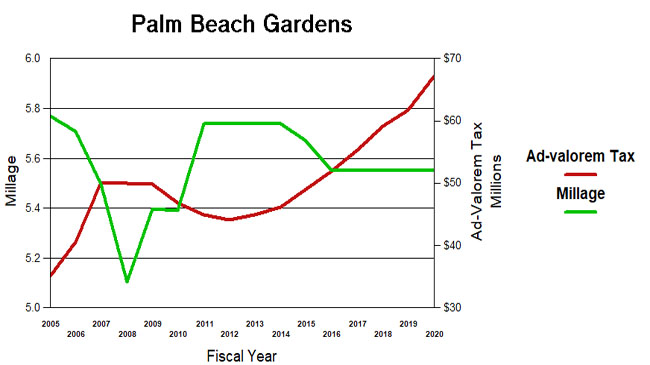
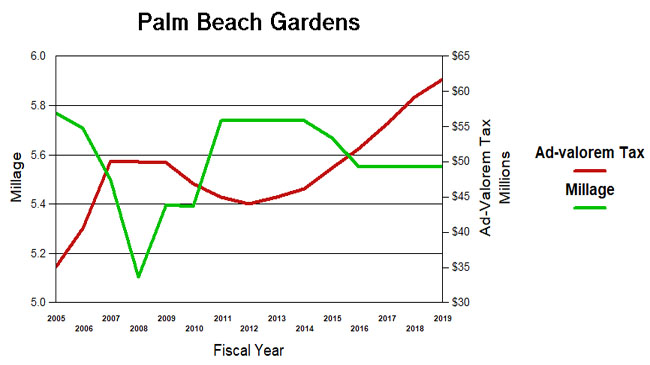
With the millage at 5.32, down from the 5.55 it has been for the last 7 years, this is the eighth year that increases in property valuations and new construction have provided a painless increase in revenue. In 2015, the last year there was a millage reduction, ad-valorem revenue was $49M. This year’s $80M is a 62% increase over the seven years of flat millage.
Similar to last year, the 2023 budget needs to be thought of differently because excessive federal spending and money printing by the Federal Reserve has brought us a repeat of the inflationary environment of the ’70s. The Bureau of Labor Statistics tracks the “CONSUMER PRICE INDEX FOR ALL URBAN CONSUMERS (CPI-U)” monthly. In July of this year, that figure stands at 297 – up a whopping 8.8% over one year ago when it was 273. At that rate, we expect a 323 CPI in the middle of the 2023 fiscal year. As you will see in the TABOR comparison, the tax increase is justified in this environment with the Biden Administration continuing to print money like there is no tomorrow.
Projecting out the PBG population estimates from the Bureau of Economic and Business Research (BEBR at UFL), the Gardens population will be just shy of 61K in 2023, up about 1%. The TABOR multiple (Taxpayer Bill of Rights – inflation times population growth) is therefore about 9.8%.
TABOR
In 1992, the state of Colorado amended their constitution to restrict the growth of taxation. Under the “Taxpayer Bill of Rights” (TABOR), state and local governments could not raise tax rates without voter approval and could not spend revenues collected under existing tax rates without voter approval if revenues grow faster than the rate of inflation and population growth. The results of this Colorado experiment are mixed, and TABOR has its pros and cons. (For background on TABOR, see: Taxpayer Bill of Rights ) Population growth and inflation though, would seem to be a way of assessing the appropriateness of the growth of a city budget, at least as an initial benchmark.
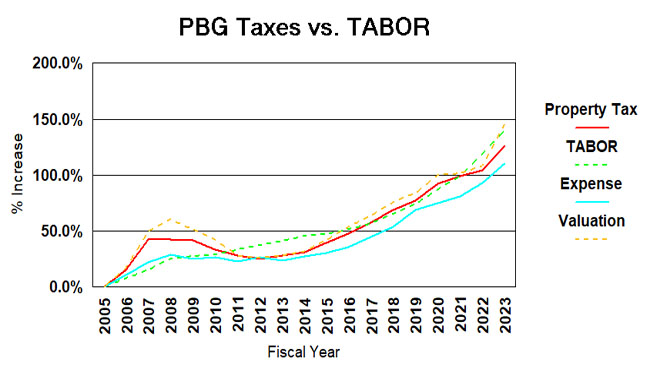
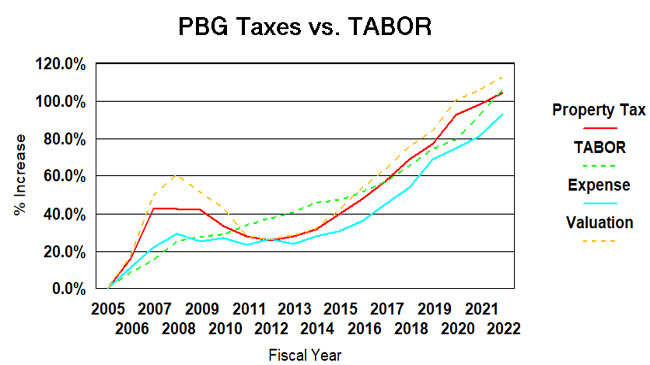
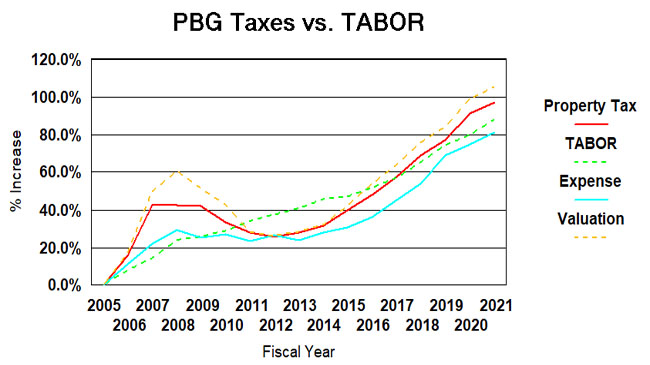
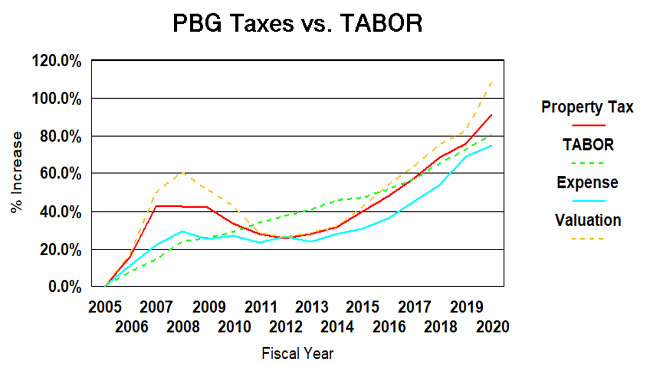
Since 2005, the population of Palm Beach Gardens will have grown by about 45% (BEBR estimate – see below) to its estimated 2023 level of 61K. Inflation, measured by the consumer price index, will be about 66%. Taken together, TABOR would suggest a growth in city spending and taxation of about 140%. (see graph below).
Over the same period (2005-2023), ad-valorem taxes grew 126% and total expenditures (budget less capital and transfers) grew 111%. Spending closely follows the TABOR line, and ad-valorem taxes is not widely divergent suggesting spending and taxation appropriate to a growing city.
It should be noted that ad-valorem taxes fund only a part of city expenditures, the rest made up from impact fees, fees for services, other taxes, intergovernmental grants, etc. and have varied from 66% of the total in 2005 to about 70% now. That is why taxes and expenses do not track each other on the chart.
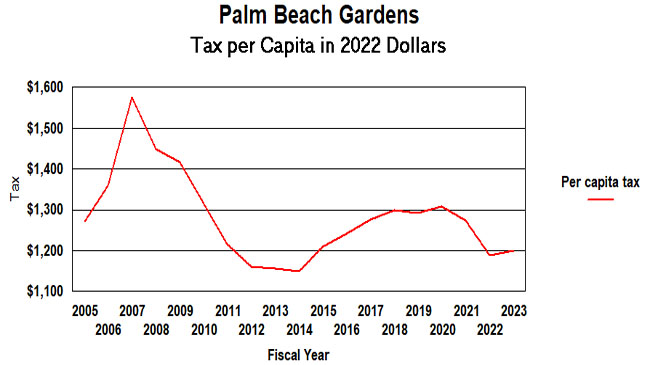
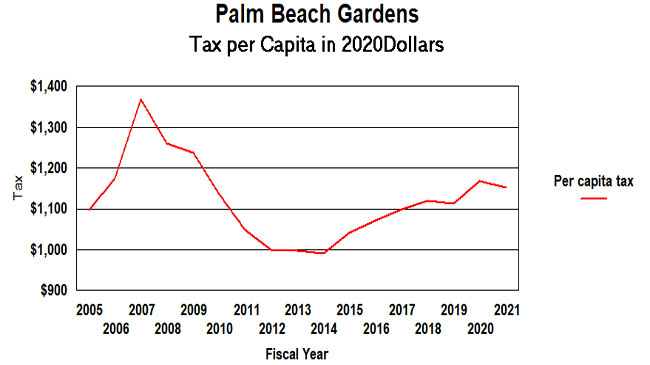
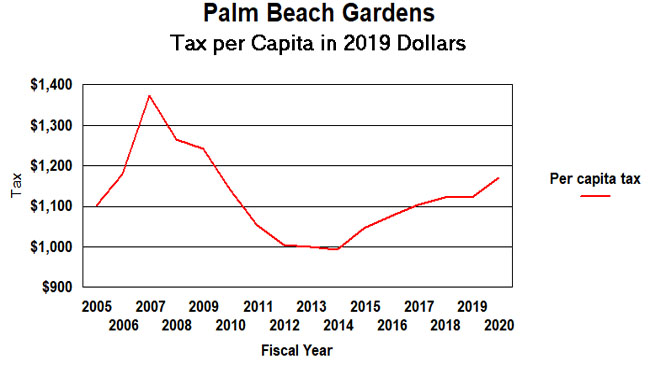
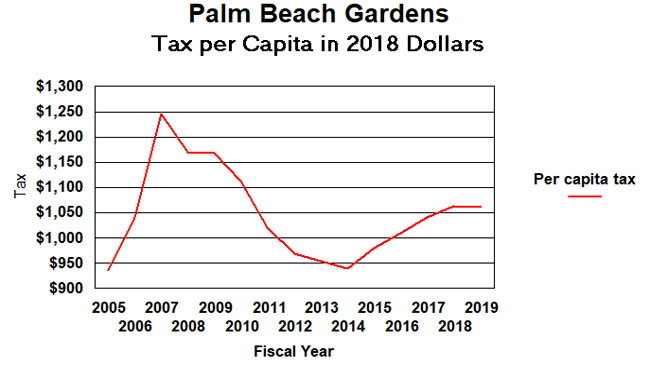
Another useful measurement is taxes per capita – Ad valorem taxes divided by population and then inflation adjusted. By this measure, in 2005 we paid $1,273 per person to our city and in 2022 it will be $1,200 (2022 dollars) – an actual decline. Tax per capita was as low as $1148 in 2014 after a millage reduction. It should be noted that as property owners, we pay taxes to other entities besides the city – county, schools, health care district, etc. In 2021 the Palm Beach Gardens portion of the amount on our TRIM statement is about 27% of the total.
The chart below shows an actual decline in per-capita taxation for two years in a row and then a flattening this year. However, there is reason to believe the BEBR population estimates have missed some of the city’s growth (see below). If the numbers were to be adjusted to match the growth in voter registrations since 2016 for example, the curve would be flatter since there are more people to pay the taxes.
So if you trust TABOR, or per-capita as measuring sticks, this modest growth in taxation (compared to inflation) for 2022 seems appropriate in our view. You be the judge.
A word about population estimates.
Estimates of the Gardens population vary. The numbers used in the preceding two charts are based on the University of Florida’s Bureau of Business and Economic Research (BEBR) data. By their measure, we have grown 42% to 2021 since 2005. The US Census has a slightly different set of numbers and they claim 41% over the same period. (Prior to the 2020 census results they were widely divergent.) BEBR says we had 59,755 residents in 2021. the Census said 59,549. Projecting to 2023 at the same rates would get approximately 60.9K and 60.2K respectively.
BEBR has been more reliable as the census numbers degrade over time. In 2017, the city annexed Osprey Isles and Carleton Oaks and in 2018 Bay Hill and Rustic Lakes. It did not appear that the census adjusts for annexations between decennials. Also, certain areas of the city are growing rapidly, such as Alton and Avenir. This will likely see a faster expansion than the current BEBR or Census trend line.
PBG 3.3% Tax Increase Actually Less than Inflation
The proposed 2021 PBG Budget raises about $2.3M in new taxes, up a modest 3.3% over last year. See the Proposed Budget here.
With the millage flat at 5.55 since reduced to that level in 2016, this is the seventh year that increases in property valuations and new construction have provided an equivalent increase in revenue without raising the tax rate. In 2015, ad-valorem revenue was $49M. This year’s $72M is a 46% increase over the six years of flat millage.
Unlike the six years previous, the 2022 budget needs to be thought of differently because excessive federal spending and money printing by the Federal Reserve has brought us a repeat of the inflationary environment of the ’70s. The Bureau of Labor Statistics tracks the “CONSUMER PRICE INDEX FOR ALL URBAN CONSUMERS (CPI-U)” monthly. In July of this year, that figure stands at 273 – up a whopping 5.4% over one year ago when it was 259. It has been climbing at a yearly rate in excess of 5% for the last 3 months, and was up 4.2% in April. In prior budget years, inflation was negligible compared to increases in the ad valorem tax. Let’s assume it continues for another 9 months and the July 2022 figure is 288. Adjusting the tax increase for inflation, the $72M becomes $68M in 2021 dollars – a $1.4M decrease (-2%) in Ad Valorem taxes.
Projecting out the PBG population estimates from the Bureau of Economic and Business Research (BEBR at UFL), the Gardens population will be just shy of 59K in 2022, up about 2%. The TABOR multiple (Taxpayer Bill of Rights – inflation times population growth) is therefore about 7.5%.
TABOR
In 1992, the state of Colorado amended their constitution to restrict the growth of taxation. Under the “Taxpayer Bill of Rights” (TABOR), state and local governments could not raise tax rates without voter approval and could not spend revenues collected under existing tax rates without voter approval if revenues grow faster than the rate of inflation and population growth. The results of this Colorado experiment are mixed, and TABOR has its pros and cons. (For background on TABOR, see: Taxpayer Bill of Rights ) Population growth and inflation though, would seem to be a way of assessing the appropriateness of the growth of a city budget, at least as an initial benchmark.
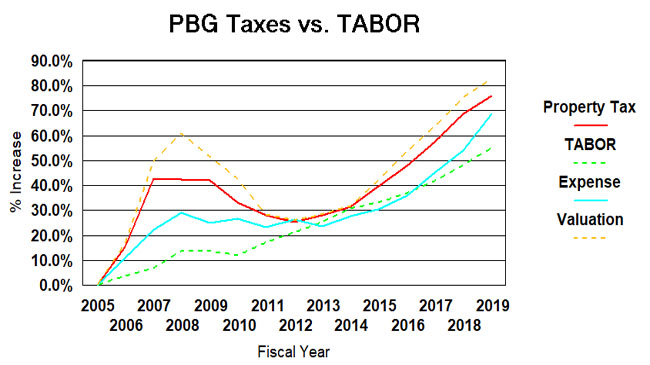
Since 2005, the population of Palm Beach Gardens will have grown by about 40% (BEBR estimate – see below) to its estimated 2022 level of 59K. Inflation, measured by the consumer price index, will be about 48%. Taken together, TABOR would suggest a growth in city spending and taxation of about 107%. (see graph below).
Over the same period (2005-2021), ad-valorem taxes grew 104% and total expenditures (budget less debt payment, capital and transfers) grew 93%. Spending closely follows the TABOR line, and ad-valorem taxes is not widely divergent (although exceeding TABOR since 2017) suggesting spending and taxation appropriate to a growing city.
It should be noted that ad-valorem taxes fund only a part of city expenditures, the rest made up from impact fees, fees for services, other taxes, intergovernmental grants, etc. and have varied from 66% of the total in 2005 to about 70% now. That is why taxes and expenses do not track each other on the chart.
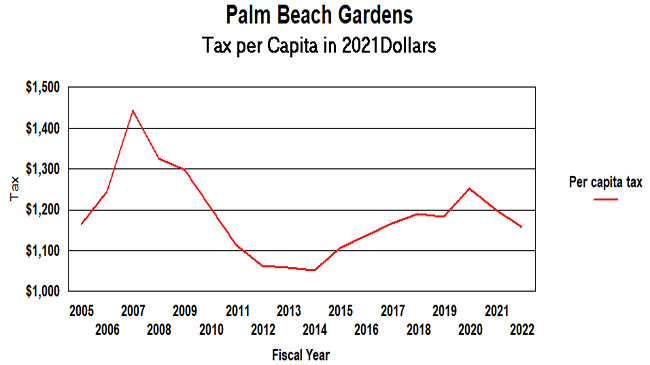
Another useful measurement is taxes per capita – Ad valorem taxes divided by population and then inflation adjusted. By this measure, in 2005 we paid $1,170 per person to our city and in 2022 it will be $1,154 (2021 dollars) – an actual decline. Tax per capita was as low as $1056 in 2014 after a millage reduction. It should be noted that as property owners, we pay taxes to other entities besides the city – county, schools, health care district, etc. In 2021 the Palm Beach Gardens portion of the amount on our TRIM statement is about 27% of the total.
The chart below shows an actual decline in per-capita taxation for two years in a row. However, there is reason to believe the BEBR population estimates have missed some of the city’s growth (see below). If the numbers were to be adjusted to match the growth in voter registrations since 2016 for example, the curve would be flatter since there are more people to pay the taxes.
So if you trust TABOR, or per-capita as measuring sticks, this modest growth in taxation for 2021 seems appropriate in our view. You be the judge.
A word about population estimates.
Estimates of the Gardens population vary. The numbers used in the preceding two charts are based on the University of Florida’s Bureau of Business and Economic Research (BEBR) data. By their measure, we have grown 34.6% to 2020 (the last number given) since 2005. The US Census has a different set of numbers and they claim 39% over the same period. BEBR says we had 56,709 residents in 2020. the Census said 58,410. Projecting to 2021 at the same rates would get approximately 59K and 60K respectively.
I have reason to believe that both of these estimates are too low. In 2017, the city annexed Osprey Isles and Carleton Oaks (about 650 residents) and in 2018 Bay Hill and Rustic Lakes (aobut 1340 residents). It is not clear that either BEBR or the census adjusts for annexations between census decennials. Also, certain areas of the city are growing rapidly, such as Alton and soon Avenir.
March 2021 Election Results
The March 9 municipal election in Palm Beach Gardens was a clear win for former Mayor Marcie Tinsley with 70% of the vote over newcomer Rob Nanfro. Nanfro won one precinct – 6064 Rustic Lakes.
With the exception of the Shady Lakes / Bent Tree precinct where the margin was only 4 points, Tinsley’s landslide victory was overwhelming. (See Map below)
The overall turnout of 16% was a lot more than what a municipal election normally sees in an off year, particularly a special election to replace a council person who left office early. In 2019 for example, turnout was only 9.5% in the low key race for Group 4 in which Carl Woods beat challenger Howard Rosenkrantz with 68% of the vote. The increased turnout may have been driven by the overhang of Vote-by-Mail ballot subscriptions from 2020. Few went to the polls on election day as an amazing 85% of the Gardens voters voted by mail.
As is often the case, BallenIsles led the way in voter turnout among the larger precincts with 31%, followed by Frenchman’s with 26%. These neighborhoods delivered 74% and 78% for Tinsley respectively.
Municipal elections are non-partisan, meaning the candidates cannot campaign as a member of a political party. Palm Beach Gardens goes farther than any other city in the county to discourage partisan activity, and actually has an ordinance that prevents a candidate from accepting money or assistance from a political party. (Code of Ordinances, Chapter 26-21 Unfair Acts)
In this case both candidates are Republicans, but partisanship was a factor as campaign ads from Rob Nanfro were claiming that Tinsley only became a Republican to run in this race. That was a stretch since Ms. Tinsley has been registered as a Republican for over 5 years. It is not clear why he thought that would have been relevant.
North county races have become somewhat nasty in recent years and this was no exception. You may recall the contest last year for County Commission District 1 where PACs supporting Maria Marino dumped $1M in negative ads to trash former Commissioner Karen Marcus. It seems to have worked.
In this race, Tinsley mostly ran on her record as Mayor and Councilman while the challenger (who is relatively new to the area and has no record) went negative. Perhaps the most questionable claim was that Tinsley was bashing Governor DeSantis over the Covid-19 Response at a Council meeting. Anyone who actually watched the video of the subject meeting would conclude just the opposite.
In our opinion there was never a doubt who would prevail. Marcie Tinsley had a good record to run on, followed the rules for term limits by sitting out for 3 years, and is appreciated by many who followed her activities on the Council over the years.
| Group 2 | ||||
|---|---|---|---|---|
| Strong Tinsley | Weak Tinsley | Very Close | Weak Nanfro | Strong Nanfro |
| Click the precinct on the map for vote totals. | ||||
| Neighborhoods | Voters | Cast | Turnout | Tinsley | Nanfro | Tinsley % | |
|---|---|---|---|---|---|---|---|
| 1186 | Mirabella | 1637 | 242 | 14.8 | 173 | 69 | 71.5 |
| 1188 | Westwood Gardens | 1034 | 104 | 10.1 | 71 | 33 | 68.3 |
| 1189 | Old Palm – North | 113 | 20 | 17.7 | 13 | 7 | 65.0 |
| 1190 | The Isles, Paloma, San Michelle, Alton | 5115 | 654 | 12.8 | 458 | 196 | 70.0 |
| 1192 | Evergrene | 1571 | 240 | 15.3 | 195 | 45 | 81.3 |
| 1194 | Frenchmans | 2289 | 585 | 25.6 | 458 | 127 | 78.3 |
| 1222 | Avenir | 40 | 5 | 12.5 | 5 | 0 | 100.0 |
| 1228 | Osprey Isles, Carleton Oaks | 481 | 79 | 16.4 | 52 | 27 | 65.8 |
| 1238 | Mirasol | 1912 | 428 | 22.4 | 290 | 138 | 67.8 |
| 1240 | PGA National | 2660 | 453 | 17.0 | 338 | 115 | 74.6 |
| 1242 | PGA National | 2704 | 577 | 21.3 | 410 | 167 | 71.1 |
| 1244 | PGA National | 1695 | 324 | 19.1 | 241 | 83 | 74.4 |
| 1246 | Bent Tree, Garden Lks, Shady Lks, Gdns of Woodbury | 2593 | 372 | 14.3 | 192 | 180 | 51.6 |
| 1247 | Old Palm – South | 271 | 46 | 17.0 | 30 | 16 | 65.2 |
| 1248 | PGA-east. | 1591 | 297 | 18.7 | 186 | 111 | 62.6 |
| 1250 | Gardens Glen | 64 | 10 | 15.6 | 5 | 5 | 50.0 |
| 1252 | BallenIsles | 2374 | 739 | 31.1 | 547 | 192 | 74.0 |
| 1254 | Hunt Club | 471 | 70 | 14.9 | 52 | 18 | 74.3 |
| 1260 | Elm Avenue | 1361 | 205 | 15.1 | 142 | 63 | 69.3 |
| 1262 | RCA Center | 2 | 0 | 0.0 | 0 | 0 | 50.0 |
| 1266 | Union Square, Randolph Way | 491 | 14 | 2.9 | 11 | 3 | 78.6 |
| 1268 | Golfers Drive, Lilac | 357 | 17 | 4.8 | 9 | 8 | 52.9 |
| 1270 | Lilac Park | 10 | 0 | 0.0 | 0 | 0 | 50.0 |
| 1272 | Holly Drive, Riverside | 2050 | 263 | 12.8 | 189 | 74 | 71.9 |
| 1274 | Gardenia Dr, Arbor Way | 1687 | 229 | 13.6 | 171 | 58 | 74.7 |
| 1280 | Lake Catherine | 434 | 77 | 17.7 | 46 | 31 | 59.7 |
| 1284 | Gardens Mall area | 2517 | 299 | 11.9 | 209 | 90 | 69.9 |
| 1288 | Oakway Circle | 40 | 8 | 20.0 | 5 | 3 | 62.5 |
| 1290 | The Oaks | 2290 | 337 | 14.7 | 240 | 97 | 71.2 |
| 1292 | Nature’s Way | 92 | 14 | 15.2 | 9 | 5 | 64.3 |
| 1296 | Prosperity Oaks, Marina Gardens | 831 | 70 | 8.4 | 54 | 16 | 77.1 |
| 1306 | US1 and PGA | 5 | 0 | 0.0 | 0 | 0 | 50.0 |
| 1310 | Ellison Wilson | 4 | 0 | 0.0 | 0 | 0 | 50.0 |
| 1324 | Oaks East, Sandelwood | 1376 | 136 | 9.9 | 94 | 42 | 69.1 |
| 1326 | Siena Oaks | 606 | 85 | 14.0 | 62 | 23 | 72.9 |
| 1340 | Landing Place | 18 | 6 | 33.3 | 3 | 3 | 50.0 |
| 1352 | Steeplechase, Montecito | 2347 | 267 | 11.4 | 166 | 101 | 62.2 |
| 1360 | Sunset | 994 | 205 | 20.6 | 120 | 85 | 58.5 |
| 1372 | Sandtree | 187 | 9 | 4.8 | 6 | 3 | 66.7 |
| 6062 | Bay Hill Estates | 945 | 164 | 17.4 | 99 | 65 | 60.4 |
| 6064 | Rustic Lakes | 133 | 19 | 14.3 | 7 | 12 | 36.8 |
Modest 3.1% Tax Increase in 2021 Budget
The proposed 2021 PBG Budget raises about $2M in new taxes, up a modest 3.1% over last year. See the Proposed Budget here.
With the millage flat at 5.55 since reduced to that level in 2016, this is the sixth year that increases in property valuations and new construction have provided an equivalent increase in revenue without raising the tax rate. In 2015, ad-valorem revenue was $49M. This year’s $69M is a 41% increase over the six years of flat millage.
If you add in the effect of the 10 year 1% sales tax surcharge which gives the city about another $3M per year, the increase over 2015 is actually about 47%.
You may recall that prior to the passage of the sales tax surcharge in 2016, PBG staff had said they didn’t need any additional sources of funds, and if it passed, would return some to the taxpayers in a millage reduction. That too changed of course when the full 10 year revenue stream was captured in a bond and allocated to projects starting immediately, including $11M for the new district park.
Assuming the flat millage budget is passed as proposed, the 3.1% tax increase compares to an estimated increase in population of about 3% and mild inflation of about 1% (July to July CPI change), so the increase is about what economic conditions would expect, although the effects of the Covid-19 shutdowns make it hard to project into the future.
TABOR
In 1992, the state of Colorado amended their constitution to restrict the growth of taxation. Under the “Taxpayer Bill of Rights” (TABOR), state and local governments could not raise tax rates without voter approval and could not spend revenues collected under existing tax rates without voter approval if revenues grow faster than the rate of inflation and population growth. The results of this Colorado experiment are mixed, and TABOR has its pros and cons. (For background on TABOR, see: Taxpayer Bill of Rights ) Population growth and inflation though, would seem to be a way of assessing the appropriateness of the growth of a city budget, at least as an initial benchmark.
Since 2005, the population of Palm Beach Gardens will have grown by about 41% (BEBR estimate – see below) to its estimated 2021 level of 59K. Inflation, measured by the consumer price index, will be about 33%. Taken together, TABOR would suggest a growth in city spending and taxation of about 88%. (see graph below).
Over the same period (2005-2021), ad-valorem taxes grew 97% and total expenditures (budget less debt payment, capital and transfers) grew 81%. Spending closely follows the TABOR line, and ad-valorem taxes is not widely divergent (although exceeding TABOR since 2017) suggesting spending and taxation appropriate to a growing city.
It should be noted that ad-valorem taxes fund only a part of city expenditures, the rest made up from impact fees, fees for services, other taxes, intergovernmental grants, etc. and have varied from 66% of the total in 2005 to about 70% now. That is why taxes and expenses do not track each other on the chart.
Another useful measurement is taxes per capita – Ad valorem taxes divided by population and then inflation adjusted. By this measure, in 2005 we paid $1,097 per person to our city and in 2021 it will be $1,152 (2020 dollars). Although not too far above the 2005 level, tax per capita was as low as $990 in 2014 after a millage reduction. It should be noted that as property owners, we pay taxes to other entities besides the city – county, schools, health care district, etc. In 2019 the Palm Beach Gardens portion of the amount on our TRIM statement is about 27% of the total.
The chart below shows an actual decline in per-capita taxation, yet there is reason to believe the BEBR population estimates have missed some of the city’s growth (see below). If the numbers are adjusted to match the growth in voter registrations since 2016 for example, the curve is much flatter since there are more people to pay the taxes.
So if you trust TABOR, or per-capita as measuring sticks, this modest growth in taxation for 2021 seems appropriate in our view. You be the judge.
A word about population estimates.
Estimates of the Gardens population vary. The numbers used in the preceding two charts are based on the University of Florida’s Bureau of Business and Economic Research (BEBR) data. By their measure, we have grown 33.6% to 2020 since 2005, and 2.3% in the last year. The US Census has a different set of numbers and they claim 37.3% and 1.4% respectively. BEBR says we had 55,621 residents in 2019. the Census said 57,067. Projecting to 2021 at the same rates would get approximately 59K by both measures.
I have reason to believe that both of these estimates are too low. In 2017, the city annexed Osprey Isles and Carleton Oaks (about 650 residents) and in 2018 Bay Hill and Rustic Lakes (aobut 1340 residents). It is not clear that either BEBR or the census adjusts for annexations between census decennials. Also, certain areas of the city are growing rapidly, such as Alton and soon Avenir.
If you look at voter registration data, assuming that the population as a whole was growing at the same rate as the voter rolls, you see more rapid growth. In 2016 there were 37,878 registered voters in the Gardens, 74% of the population based on BEBR. Today (August 2020), the voter rolls have grown to 45,923, up 21%. A similar ratio applied to population would yield 62,457 residents in 2020, and by extension, 63,890 in 2021. Precinct 1190 (which includes Alton and is now the largest precinct in the county) now has about 4800 voters. In 2014 it had about 2500.
2020 Municipal Election Results
The March 17 municipal election in Palm Beach Gardens was a clear win for challenger Chelsea Reed with 52% of the vote over incumbent Councilman Matthew Lane. Many of the individual precincts were close though.
Lane carried BallenIsles, Frenchman’s Reserve and Creek, Old Palm, Osprey Isles / Carleton Oaks, Mirasol, Mirabella, Rustic Lakes and Bay Hill Estates. Reed carried the rest and was particularly strong in PGA National, Bent Tree / Garden Lakes / Shady Lakes, Evergrene and Westwood Gardens. (See Map)
The overall turnout of 22% was twice what a municipal election normally sees, but very light for a Presidential Preference Primary. In 2016, about 16,000 Gardens residents went to the polls for a 42% turnout. That year delivered 51% to David Levy in a three way race before a court overturned it in favor of Carl Woods.
The Group 1 and 5 seats were up for re-election this year, but no one came forward to challenge Rachelle Litt or Mark Marciano and so they won by default.
Municipal elections are non-partisan, meaning the candidates cannot campaign as a member of a political party. In reality though, when the candidates are registered in different parties, the word gets out on who is who, and at least some of the voting is driven by party affiliation, particularly among voters who don’t follow city business. Think about that as supporting candidates who “share their values.” Palm Beach Gardens goes farther than any other city in the county to discourage partisan activity, and actually has an ordinance that prevents a candidate from accepting money or assistance from a political party. (Code of Ordinances, Chapter 26-21 Unfair Acts)
A candidate’s affiliation can often be determined by their endorsements. Chelsea Reed carried endorsements from just about every Democrat office holder in the county, from Congresswoman Lois Frankel, down through state senators and representatives, county commissioners and Democrat officials from other cities. Matthew Lane’s endorsements from individuals were mostly from Republican officials, both current and former.
Since the Gardens has an R+7 electorate, you would think that Matt would have had an advantage, but he made it clear early on that he did not want to associate with his party, and many political activists who would have normally helped such a candidate sat on the sidelines.
Chelsea Reed on the other hand, had a big team of supporters doing sign waving at the library during early voting, seemingly led by former Mayor and Councilman Eric Jablin who was there most days.
Hovering over all of this was the strange turnout numbers county-wide that were influenced by Corona Virus fears, and the preponderance of Democrat voters given the choices in the Presidential primary.
In our opinion though, Chelsea Reed ran the better campaign, put in the work, got out the vote, and deserves the win she achieved.
Group 3
| Group 3 | ||||
|---|---|---|---|---|
| Strong Reed | Weak Reed | Very Close | Weak Lane | Strong Lane |
| Click the precinct on the map for vote totals. | ||||
| Neighborhoods | Voters | Cast | Turnout | Reed | Lane | Reed Margin | |
|---|---|---|---|---|---|---|---|
| 1186 | Mirabella | 1561 | 379 | 24.3 | 170 | 209 | 44.9 |
| 1188 | Westwood Gardens | 957 | 205 | 21.4 | 116 | 89 | 56.6 |
| 1189 | Old Palm – North | 107 | 22 | 20.6 | 7 | 15 | 31.8 |
| 1190 | The Isles\ Paloma\ San Michelle\ Alton | 4555 | 839 | 18.4 | 440 | 399 | 52.4 |
| 1192 | Evergrene | 1547 | 287 | 18.6 | 160 | 127 | 55.7 |
| 1194 | Frenchmans | 2197 | 560 | 25.5 | 229 | 331 | 40.9 |
| 1222 | Avenir | 13 | 4 | 30.8 | 2 | 2 | 50.0 |
| 1228 | Osprey Isles\ Carleton Oaks | 455 | 133 | 29.2 | 54 | 79 | 40.6 |
| 1238 | Mirasol | 1838 | 402 | 21.9 | 189 | 213 | 47.0 |
| 1240 | PGA National | 2576 | 603 | 23.4 | 337 | 266 | 55.9 |
| 1242 | PGA National | 2665 | 673 | 25.3 | 369 | 304 | 54.8 |
| 1244 | PGA National | 1612 | 344 | 21.3 | 188 | 156 | 54.7 |
| 1246 | Bent Tree\ Garden Lks\ Shady Lks\ Gdns of Woodbury | 2556 | 550 | 21.5 | 308 | 242 | 56.0 |
| 1247 | Old Palm – South | 265 | 46 | 17.4 | 15 | 31 | 32.6 |
| 1248 | PGA-east. | 1558 | 381 | 24.5 | 205 | 176 | 53.8 |
| 1250 | Gardens Glen | 64 | 17 | 26.6 | 2 | 15 | 11.8 |
| 1252 | BallenIsles | 2348 | 742 | 31.6 | 335 | 407 | 45.1 |
| 1254 | Hunt Club | 449 | 101 | 22.5 | 52 | 49 | 51.5 |
| 1260 | Elm Avenue | 1333 | 323 | 24.2 | 193 | 130 | 59.8 |
| 1262 | RCA Center | 2 | 0 | 0.0 | 0 | 0 | 50.0 |
| 1264 | Northcorp | 1 | 0 | 0.0 | 0 | 0 | 50.0 |
| 1266 | Union Square\ Randolph Way | 475 | 52 | 10.9 | 35 | 17 | 67.3 |
| 1268 | Golfers Drive\ Lilac | 317 | 37 | 11.7 | 25 | 12 | 67.6 |
| 1270 | Lilac Park | 11 | 1 | 9.1 | 1 | 0 | 100.0 |
| 1272 | Holly Drive\ Riverside | 1992 | 472 | 23.7 | 288 | 184 | 61.0 |
| 1274 | Gardenia Dr\ Arbor Way | 1625 | 344 | 21.2 | 175 | 169 | 50.9 |
| 1280 | Lake Catherine | 407 | 97 | 23.8 | 53 | 44 | 54.6 |
| 1284 | Gardens Mall area | 2344 | 405 | 17.3 | 226 | 179 | 55.8 |
| 1288 | Oakway Circle | 36 | 14 | 38.9 | 10 | 4 | 71.4 |
| 1290 | The Oaks | 2165 | 500 | 23.1 | 263 | 237 | 52.6 |
| 1292 | Nature’s Way | 91 | 24 | 26.4 | 17 | 7 | 70.8 |
| 1296 | Prosperity Oaks\ Marina Gardens | 795 | 89 | 11.2 | 57 | 32 | 64.0 |
| 1306 | US1 and PGA | 8 | 0 | 0.0 | 0 | 0 | 50.0 |
| 1310 | Ellison Wilson | 4 | 0 | 0.0 | 0 | 0 | 50.0 |
| 1324 | Oaks East\ Sandelwood | 1329 | 235 | 17.7 | 133 | 102 | 56.6 |
| 1326 | Siena Oaks | 589 | 148 | 25.1 | 91 | 57 | 61.5 |
| 1340 | Landing Place | 16 | 9 | 56.3 | 6 | 3 | 66.7 |
| 1352 | Steeplechase\ Montecito | 2242 | 405 | 18.1 | 245 | 160 | 60.5 |
| 1360 | Sunset | 946 | 253 | 26.7 | 127 | 126 | 50.2 |
| 1372 | Sandtree | 184 | 27 | 14.7 | 15 | 12 | 55.6 |
| 6062 | Bay Hill Estates | 877 | 228 | 26.0 | 87 | 141 | 38.2 |
| 6064 | Rustic Lakes | 127 | 29 | 22.8 | 13 | 16 | 44.8 |
| TOTAL | Palm Beach Gardens | 45239 | 9980 | 22.1 | 5238 | 4742 | 52.4 |
8.8% Tax Increase in 2020 Proposed Budget
The proposed 2020 PBG Budget raises $5.5M in new taxes, up whopping 8.8% over last year. See the Proposed Budget here.
With the millage flat at 5.55 since reduced to that level in 2016, this is the fifth year that increases in property valuations and new construction have flowed money into the city coffers without having to say they “raised taxes”. In 2015, ad-valorem revenue was $49M. This year’s $67M is a 38% increase in tax haul over 5 years.
If you add in the effect of the 10 year 1% sales tax surcharge which gives the city about another $3M per year, the increase over 2015 is actually 67%.
You may recall that prior to the passage of the sales tax surcharge in 2016, PBG staff had said they didn’t need any additional sources of funds, and if it passed, would return some to the taxpayers in a millage reduction. That too changed of course when the full 10 year revenue stream was captured in a bond and allocated to projects starting immediately, including $11M for a new park.
Assuming the flat millage budget is passed, the 8.8% tax increase compares to an increase in population of about 2.3% and about 2% inflation, so the increase is about twice what economic conditions would expect. A token decrease in millage to 5.50 suggested by Mayor Marciano (representing about $600K), would still produce taxes far above what population and inflation would suggest.
TABOR
In 1992, the state of Colorado amended their constitution to restrict the growth of taxation. Under the “Taxpayer Bill of Rights” (TABOR), state and local governments could not raise tax rates without voter approval and could not spend revenues collected under existing tax rates without voter approval if revenues grow faster than the rate of inflation and population growth. The results of this Colorado experiment are mixed, and TABOR has its pros and cons. (For background on TABOR, see: Taxpayer Bill of Rights ) Population growth and inflation though, would seem to be a way of assessing the appropriateness of the growth of a city budget, at least as an initial benchmark.
Since 2005, the population of Palm Beach Gardens will have grown by about 34% (BEBR estimate – see below) to its 2020 level of 56K. Inflation, measured by the consumer price index, will be about 35%. Taken together, TABOR would suggest a growth in city spending and taxation of about 80%. (see graph below).
Over the same period (2005-2020), ad-valorem taxes grew 91% and total expenditures (budget less debt payment, capital and transfers) grew 75%. Spending closely follows the TABOR line, and ad-valorem taxes is not widely divergent (although exceeding TABOR since 2014) suggesting spending and taxation appropriate to a growing city.
It should be noted that ad-valorem taxes fund only a part of city expenditures, the rest made up from impact fees, fees for services, other taxes, intergovernmental grants, etc. and have varied from 66% of the total in 2005 to about 73% now. That is why taxes and expenses do not track each other on the chart.
Another useful measurement is taxes per capita – Ad valorem taxes divided by population and then inflation adjusted. By this measure, in 2005 we paid $1,101 per person to our city and in 2020 it will be $1,122 (2019 dollars). Although not too far above the 2005 level, tax per capita was as low as $994 in 2014 after a millage reduction. It should be noted that as property owners, we pay taxes to other entities besides the city – county, schools, health care district, etc. In 2019 the Palm Beach Gardens portion of the amount on our TRIM statement is about 27% of the total.
The chart below shows a steady growth in per-capita taxation, yet there is reason to believe the BEBR population estimates have missed some of the city’s growth (see below). If the numbers are adjusted to match the growth in voter registrations since 2016 for example, the curve is much flatter since there are more people to pay the taxes.
So if you trust TABOR, or per-capita as measuring sticks, is this growth in taxation appropriate? You be the judge.
A word about population estimates.
Estimates of the Gardens population vary. The numbers used in the preceding two charts are based on the University of Florida’s Bureau of Business and Economic Research (BEBR) data. By their measure, we have grown 33.6% since 2005, and 2.3% in the last year. The US Census has a different set of numbers and they claim 37.3% and 1.4% respectively. BEBR says we will have 56,302 residents next April, the Census says 57,860.
I have reason to believe that both of these estimates are too low. In 2017, the city annexed Osprey Isles and Carleton Oaks (about 650 residents) and in 2018 Bay Hill and Rustic Lakes (aobut 1340 residents). It is not clear that either BEBR or the census adjusts for annexations between census decinnials. Also, certain areas of the city are growing rapidly, such as Alton.
If you look at voter registration data, assuming that the population as a whole was growing at the same rate as the voter rolls, you see more rapid growth. In 2016 there were 37,878 registered voters in the Gardens, 74% of the population based on BEBR. By 2019, the voter rolls had grown to 44,847, up 18%. A similar ratio applied to population would yield 61,013 residents in 2019, and by extension, 65,028 in 2020. Precinct 1190 (which includes Alton) now has about 4300 voters. In 2014 it had about 2500.
The Voters Speak: A Resounding NO! to More Terms for Council Members
On August 28, almost 12,000 residents weighed in on the three PBG charter questions. This was almost three times the participation in the March election at which the Council first sought to resolve the questions.
In March, 2 questions were thrown out by a circuit court judge for being misleading, and they were clarified and put back on the August ballot as questions 1 and 2, with one issue (City Manager residency) separated out into question 3. March question 3 (Run Again) was allowed to go forward and did pass, but is still being challenged at the court of appeals.
The city had spent $35,000 for the March election, and then another $65,000 for August, ostensibly to “educate” the voters. Unfortunately, the campaign that resulted used misinformation to influence the voters to vote YES on all three questions, and this expenditure is being challenged in yet another lawsuit. The city’s actions, and the challenge to them, caught the attention of many residents through articles in the Palm Beach Post, and citizen’s sharing the news on social media and in emails.
The vote was definitive. Much as the original term limits question was passed with 80% in November 2014, voters said NO to the Council’s desire to have three terms instead of two (question 1), and they rejected the repeal of the City Manager residency requirement (question 3). Both of these were rejected by close to a 2 to 1 margin, and almost every precinct in the city voted NO by more than 15 points.
Question 2, which dealt with a general cleanup of the Charter passed with 60% of the vote.
Given the split vote (The city wanted YES to all, opponents wanted NO to all), you can probably conclude that voters were willing to trust the city to a certain extent that the charter rewrite was necessary, but soundly rejected the Council’s desire for more time in office.
It should be noted that a typical Gardens’s election shows a strong variation in the vote of different parts of the city. There are differences between gated and non-gated communities, eastern and western sections, older and newer areas, those with strong HOAs and those without. The March election showed these differences, but pointedly, the August election did not. It should be noted that March elections where city races are usually decided, have smaller turnout and tend to draw those that are most aware of city issues. City issues are incidental in August and November elections which primarily are deciding state and national races. The larger electorates at these times are likely to decide based on a “policy filter” (eg. “we like term limits”), rather than a personal one (eg: “I trust the Mayor so will vote her way”). Of course, whether you follow city issues or not, if you live in Palm Beach Gardens, your vote is as good as any other, and higher turnout is good for Democracy.
Hopefully, the city and Council will respect the wishes of the voters this time and we can put this all behind us.
Below are the results from the August election:
Question 1 – Three terms instead of two?
| Question 1 – Three terms instead of two | ||||
|---|---|---|---|---|
| Strong Yes | Weak Yes | Very Close | Weak No | Strong No |
| Click the precinct on the map for vote totals. | ||||
| Registered | Cast | Turnout% | YES | NO | Yes Margin% | ||
|---|---|---|---|---|---|---|---|
| 1186 | Mirabella | 1436 | 417 | 29 | 138 | 257 | 35 |
| 1188 | Westwood Gardens | 895 | 263 | 29 | 80 | 169 | 32 |
| 1189 | Old Palm – North | 95 | 17 | 18 | 4 | 13 | 24 |
| 1190 | The Isles, Paloma, San Michelle, Alton | 3547 | 980 | 28 | 344 | 592 | 37 |
| 1192 | Evergreen | 1440 | 400 | 28 | 121 | 253 | 32 |
| 1194 | Frenchmans | 2023 | 616 | 30 | 257 | 329 | 44 |
| 1228 | Osprey Isles, Carleton Oaks | 451 | 170 | 38 | 64 | 98 | 40 |
| 1238 | Mirasol | 1696 | 451 | 27 | 93 | 336 | 22 |
| 1240 | PGA National | 2454 | 750 | 31 | 266 | 449 | 37 |
| 1242 | PGA National | 2542 | 709 | 28 | 261 | 405 | 39 |
| 1244 | PGA National | 1537 | 503 | 33 | 185 | 291 | 39 |
| 1246 | Bent Tree, Garden Lks, Shady Lks, Gdns of Woodbury | 2382 | 610 | 26 | 146 | 442 | 25 |
| 1247 | Old Palm – South | 228 | 54 | 24 | 13 | 38 | 25 |
| 1248 | PGA-east. | 1497 | 499 | 33 | 152 | 330 | 32 |
| 1250 | Gardens Glen | 63 | 26 | 41 | 11 | 13 | 46 |
| 1252 | BallenIsles | 2288 | 802 | 35 | 294 | 475 | 38 |
| 1254 | Hunt Club | 445 | 154 | 35 | 39 | 106 | 27 |
| 1260 | Elm Avenue | 1294 | 472 | 36 | 118 | 338 | 26 |
| 1266 | Union Square, Randolph Way | 462 | 56 | 12 | 26 | 28 | 48 |
| 1268 | Golfers Drive, Lilac | 298 | 37 | 12 | 13 | 21 | 38 |
| 1270 | Lilac Park | 10 | 1 | 10 | 0 | 1 | 0 |
| 1272 | Holly Drive, Riverside | 1900 | 579 | 30 | 172 | 387 | 31 |
| 1274 | Gardenia Dr, Arbor Way | 1581 | 481 | 30 | 149 | 318 | 32 |
| 1280 | Lake Catherine | 392 | 129 | 33 | 57 | 69 | 45 |
| 1284 | Gardens Mall area | 2170 | 508 | 23 | 201 | 283 | 42 |
| 1288 | Oakway Circle | 38 | 13 | 34 | 4 | 8 | 33 |
| 1290 | The Oaks | 2084 | 633 | 30 | 196 | 408 | 32 |
| 1292 | Nature’s Way | 73 | 29 | 40 | 15 | 14 | 52 |
| 1296 | Prosperity Oaks, Marina Gardens | 727 | 149 | 20 | 54 | 84 | 39 |
| 1324 | Oaks East, Sandelwood | 1258 | 307 | 24 | 96 | 193 | 33 |
| 1326 | Siena Oaks | 557 | 206 | 37 | 68 | 129 | 35 |
| 1340 | Landing Place | 14 | 9 | 64 | 6 | 3 | 67 |
| 1352 | Steeplechase, Montecito | 2202 | 627 | 28 | 237 | 367 | 39 |
| 1360 | Sunset | 889 | 290 | 33 | 90 | 190 | 32 |
| 1372 | Sandtree | 162 | 32 | 20 | 10 | 22 | 31 |
| 6062 | Bay Hill Estates | 814 | 269 | 33 | 104 | 151 | 41 |
| 6064 | Rustic Lakes | 122 | 35 | 29 | 7 | 27 | 21 | TOTALS | 42066 | 12283 | 29% | 4091 | 7637 | 35% |
Question 2 – Charter Cleanup?
| Question 2 – Charter Cleanup? | ||||
|---|---|---|---|---|
| Strong Yes | Weak Yes | Very Close | Weak No | Strong No |
| Click the precinct on the map for vote totals. | ||||
| Registered | Cast | Turnout% | YES | NO | Yes Margin% | ||
|---|---|---|---|---|---|---|---|
| 1186 | Mirabella | 1436 | 417 | 29 | 223 | 163 | 58 |
| 1188 | Westwood Gardens | 895 | 263 | 29 | 141 | 99 | 59 |
| 1189 | Old Palm – North | 95 | 17 | 18 | 16 | 1 | 94 |
| 1190 | The Isles, Paloma, San Michelle, Alton | 3547 | 980 | 28 | 582 | 305 | 66 |
| 1192 | Evergreen | 1440 | 400 | 28 | 222 | 104 | 68 |
| 1194 | Frenchmans | 2023 | 616 | 30 | 369 | 181 | 67 |
| 1228 | Osprey Isles, Carleton Oaks | 451 | 170 | 38 | 102 | 44 | 70 |
| 1238 | Mirasol | 1696 | 451 | 27 | 217 | 203 | 52 |
| 1240 | PGA National | 2454 | 750 | 31 | 387 | 304 | 56 |
| 1242 | PGA National | 2542 | 709 | 28 | 423 | 233 | 64 |
| 1244 | PGA National | 1537 | 503 | 33 | 261 | 190 | 58 |
| 1246 | Bent Tree, Garden Lks, Shady Lks, Gdns of Woodbury | 2382 | 610 | 26 | 259 | 288 | 47 |
| 1247 | Old Palm – South | 228 | 54 | 24 | 33 | 11 | 75 |
| 1248 | PGA-east. | 1497 | 499 | 33 | 250 | 212 | 54 |
| 1250 | Gardens Glen | 63 | 26 | 41 | 15 | 9 | 63 |
| 1252 | BallenIsles | 2288 | 802 | 35 | 435 | 313 | 58 |
| 1254 | Hunt Club | 445 | 154 | 35 | 77 | 59 | 57 |
| 1260 | Elm Avenue | 1294 | 472 | 36 | 244 | 197 | 55 |
| 1266 | Union Square, Randolph Way | 462 | 56 | 12 | 37 | 13 | 74 |
| 1268 | Golfers Drive, Lilac | 298 | 37 | 12 | 22 | 11 | 67 |
| 1270 | Lilac Park | 10 | 1 | 10 | 1 | 0 | 100 |
| 1272 | Holly Drive, Riverside | 1900 | 579 | 30 | 287 | 257 | 53 |
| 1274 | Gardenia Dr, Arbor Way | 1581 | 481 | 30 | 232 | 214 | 52 |
| 1280 | Lake Catherine | 392 | 129 | 33 | 82 | 38 | 68 |
| 1284 | Gardens Mall area | 2170 | 508 | 23 | 335 | 121 | 73 |
| 1288 | Oakway Circle | 38 | 13 | 34 | 8 | 4 | 67 |
| 1290 | The Oaks | 2084 | 633 | 30 | 355 | 207 | 63 |
| 1292 | Nature’s Way | 73 | 29 | 40 | 20 | 6 | 77 |
| 1296 | Prosperity Oaks, Marina Gardens | 727 | 149 | 20 | 85 | 37 | 70 |
| 1324 | Oaks East, Sandelwood | 1258 | 307 | 24 | 160 | 117 | 58 |
| 1326 | Siena Oaks | 557 | 206 | 37 | 107 | 73 | 59 |
| 1340 | Landing Place | 14 | 9 | 64 | 5 | 0 | 100 |
| 1352 | Steeplechase, Montecito | 2202 | 627 | 28 | 366 | 200 | 65 |
| 1360 | Sunset | 889 | 290 | 33 | 155 | 113 | 58 |
| 1372 | Sandtree | 162 | 32 | 20 | 22 | 8 | 73 |
| 6062 | Bay Hill Estates | 814 | 269 | 33 | 177 | 57 | 76 |
| 6064 | Rustic Lakes | 122 | 35 | 29 | 15 | 17 | 47 | TOTALS | 42066 | 12283 | 29% | 6727 | 4409 | 60% |
Question 3 – Repeal City Manager Residency Requirement?
| Question 3 – Repeal City Manager Residency Requirement? | ||||
|---|---|---|---|---|
| Strong Yes | Weak Yes | Very Close | Weak No | Strong No |
| Click the precinct on the map for vote totals. | ||||
| Registered | Cast | Turnout% | YES | NO | Yes Margin% | ||
|---|---|---|---|---|---|---|---|
| 1186 | Mirabella | 1436 | 417 | 29 | 111 | 279 | 28 |
| 1188 | Westwood Gardens | 895 | 263 | 29 | 69 | 172 | 29 |
| 1189 | Old Palm – North | 95 | 17 | 18 | 8 | 8 | 50 |
| 1190 | The Isles, Paloma, San Michelle, Alton | 3547 | 980 | 28 | 255 | 642 | 28 |
| 1192 | Evergreen | 1440 | 400 | 28 | 109 | 221 | 33 |
| 1194 | Frenchmans | 2023 | 616 | 30 | 254 | 298 | 46 |
| 1228 | Osprey Isles, Carleton Oaks | 451 | 170 | 38 | 47 | 105 | 31 |
| 1238 | Mirasol | 1696 | 451 | 27 | 119 | 305 | 28 |
| 1240 | PGA National | 2454 | 750 | 31 | 208 | 493 | 30 |
| 1242 | PGA National | 2542 | 709 | 28 | 230 | 426 | 35 |
| 1244 | PGA National | 1537 | 503 | 33 | 129 | 332 | 28 |
| 1246 | Bent Tree, Garden Lks, Shady Lks, Gdns of Woodbury | 2382 | 610 | 26 | 117 | 444 | 21 |
| 1247 | Old Palm – South | 228 | 54 | 24 | 18 | 28 | 39 |
| 1248 | PGA-east. | 1497 | 499 | 33 | 118 | 345 | 25 |
| 1250 | Gardens Glen | 63 | 26 | 41 | 7 | 16 | 30 |
| 1252 | BallenIsles | 2288 | 802 | 35 | 286 | 477 | 37 |
| 1254 | Hunt Club | 445 | 154 | 35 | 39 | 100 | 28 |
| 1260 | Elm Avenue | 1294 | 472 | 36 | 108 | 343 | 24 |
| 1266 | Union Square, Randolph Way | 462 | 56 | 12 | 16 | 34 | 32 |
| 1268 | Golfers Drive, Lilac | 298 | 37 | 12 | 10 | 23 | 30 |
| 1270 | Lilac Park | 10 | 1 | 10 | 0 | 1 | 0 |
| 1272 | Holly Drive, Riverside | 1900 | 579 | 30 | 128 | 417 | 23 |
| 1274 | Gardenia Dr, Arbor Way | 1581 | 481 | 30 | 106 | 349 | 23 |
| 1280 | Lake Catherine | 392 | 129 | 33 | 39 | 83 | 32 |
| 1284 | Gardens Mall area | 2170 | 508 | 23 | 149 | 310 | 32 |
| 1288 | Oakway Circle | 38 | 13 | 34 | 5 | 7 | 42 |
| 1290 | The Oaks | 2084 | 633 | 30 | 177 | 401 | 31 |
| 1292 | Nature’s Way | 73 | 29 | 40 | 12 | 14 | 46 |
| 1296 | Prosperity Oaks, Marina Gardens | 727 | 149 | 20 | 41 | 84 | 33 |
| 1324 | Oaks East, Sandelwood | 1258 | 307 | 24 | 76 | 201 | 27 |
| 1326 | Siena Oaks | 557 | 206 | 37 | 60 | 124 | 33 |
| 1340 | Landing Place | 14 | 9 | 64 | 1 | 4 | 20 |
| 1352 | Steeplechase, Montecito | 2202 | 627 | 28 | 197 | 373 | 35 |
| 1360 | Sunset | 889 | 290 | 33 | 78 | 189 | 29 |
| 1372 | Sandtree | 162 | 32 | 20 | 8 | 22 | 27 |
| 6062 | Bay Hill Estates | 814 | 269 | 33 | 84 | 149 | 36 |
| 6064 | Rustic Lakes | 122 | 35 | 29 | 9 | 23 | 28 | TOTALS | 42066 | 12283 | 29% | 3428 | 7842 | 30% |
$2.5M Tax Increase in 2019 Budget
The 2019 PBG Budget raises $2.5M in new taxes, up 4.3% over last year. See the Proposed Budget here.
When the new budget was introduced to set the millage at the July meeting, it contained a generous increase in reserves, and had led one to hope that there was room for at least a token millage reduction, even with the potential for the passage of Amendment 1 in November. (Amendment 1 would increase the homestead exemption and reduce the tax take of the counties and municipalities.)
That is less likely now, as the Council (with a room full of uniformed officers staring them down) unanimously passed an emergency 12% raise for the Gardens Police in August. This was done with little advance notice and with little discussion, other than that the Sheriff was hiring with big bucks and many of the officers would be leaving the Gardens if they didn’t get more money. The net result (since the maximum millage had already been set) was to fund it from reserves.
You may recall that prior to the passage of the sales tax surcharge in 2016, PBG staff had said they didn’t need any additional sources of funds, and if it passed, would return some to the taxpayers in a millage reduction. That too changed of course when the full 10 year revenue stream was captured in a bond and allocated to projects starting immediately, including $11M for a new park.
Assuming the flat millage budget is passed, it will raise about $62M in Ad-Valorem taxes, up over 4% from last year. In the last year, inflation has increased by 2.8% and population by about 1.7%, so the increase is not out of line.
TABOR
In 1992, the state of Colorado amended their constitution to restrict the growth of taxation. Under the “Taxpayer Bill of Rights” (TABOR), state and local governments could not raise tax rates without voter approval and could not spend revenues collected under existing tax rates without voter approval if revenues grow faster than the rate of inflation and population growth. The results of this Colorado experiment are mixed, and TABOR has its pros and cons. (For background on TABOR, see: Taxpayer Bill of Rights ) Population growth and inflation though, would seem to be a way of assessing the appropriateness of the growth of a city budget, at least as an initial benchmark.
Since 2005, the population of Palm Beach Gardens will have grown by about 16% to its 2019 projection of 56,590 (est.) Inflation, measured by the consumer price index, will be about 33%. Taken together, TABOR would suggest a growth in city spending and taxation of about 55%. (see graph below).
Over the same period (2005-2019), ad-valorem taxes grew 76% and total expenditures (budget less debt payment, capital and transfers) grew 69%. Both are above the TABOR line, but note that in 2013, reductions in tax collection had actually returned to the trendline. It is only since then that we seem to be off to the races.
It should be noted that ad-valorem taxes fund only a part of city expenditures, the rest made up from impact fees, fees for services, other taxes, intergovernmental grants, etc. and have varied from 66% of the total in 2005 to about 69% now. That is why taxes and expenses do not track each other on the chart.
Another useful measurement is taxes per capita – Ad valorem taxes divided by population and then inflation adjusted. By this measure, in 2005 we paid $936 per person to our city and in 2019 it will be $1060 (2018 dollars). It should be noted that as property owners, we pay taxes to other entities besides the city – county, schools, health care district, etc. In 2019 the Palm Beach Gardens portion of the amount on our TRIM statement is about 27% of the total.
So if you trust TABOR, or per-capita as measuring sticks, is this growth in taxation excessive? You be the judge.
Why do Politicians Always Break your Heart?

It’s so disappointing.
What is it about political office that turns rational human beings seeking public service into tone deaf politicians out of touch with those who elected them?
None of the PBG Council has been in office longer than 19 months, three for only 7 months. None of them would be there if not for term limits. During their brief tenure, they have gathered respect and appreciation from a citizenry that is willing to give them the benefit of a fresh start after years of arrogance and lack of transparency from the Council they replaced.
So why are they willing to sour the relationship so soon? Why are they picking a fight with the very citizen activists who helped them succeed?
Term limits did not come easy. It took several attempts over years of effort. It took standing on corners and going door to door to get petitions signed. It took a lawsuit to force the city and the Supervisor of Elections to put it on the ballot. It took money and hard work.
Even when 16,000 voters gave term limits a resounding “YES” in 2014 by a 4 to 1 margin, the fight was not over. A candidate who was ineligible under the new rules ran anyway, and the city seated him. It took a lawsuit and an appeal to the 4th DCA to get the city to obey the law and seat the rightful winner Carl Woods.
Now the Council wants to throw all that out and redraw the charter to give themselves 9 years of eligibility instead of the 6 year limit the voters approved. They want to change it again to allow those term limited out to run again. And they want to tinker with the election process to throw out votes cast for withdrawn candidates and not require a majority to win.
As someone who put time and money into this effort, I feel betrayed. As someone who supported Carl Woods and contributed to the effort to seat him in the lawsuit I feel doubly betrayed as he makes the rounds of media appearances telling all who will listen that “everyone I know wants me around for 9 years”. No Carl, you ran with the understanding that 6 years was the limit. Perhaps in your case it should be only 3.
If the Council goes ahead with this it will all appear on the ballot in March of next year (2018), at a time when no candidates are up for election and the turnout is expected to be very low. You can bet that the council and the city will do all they can to drive their cronies to the polls to support this betrayal of the voters, and those who believe in term limits will have to spend more time and money to defeat it.
So sad. And so avoidable.
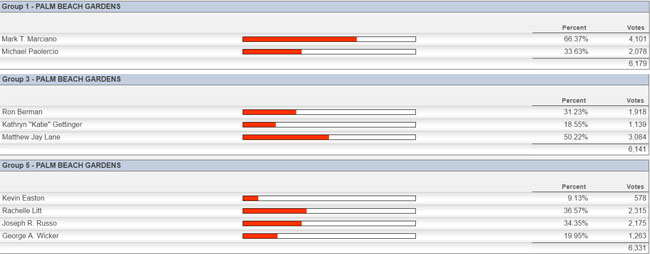
Good turnout for PBG Election
Congratulations to the winner in Group 1, Dr. Mark Marciano, who dominated the race with 66% of the vote over challenger Michael Paolercio, and in Group 3 to Matthew Lane who topped 50% in a three way race by 13 votes to avoid a runoff. The Group 5 race moves to a runoff between Rachelle Litt and Joe Russo who captured 37% and 34% respectively in the 4 way race.
Election results last evening were somewhat sporadic, with the Supervisor’s website lagging some of the other reporting sites. Accurate vote counts were not available at pbcelections.org until this morning. At one point during the evening, the wrong candidates were reported in various places as having won or advancing to the runoff. For some reason, Palm Beach County still has difficulty with election results and we really haven’t shaken the “curse of the hanging chad.”
Turnout for the three races averaged about 6200 – about 14% of the registered voters. Although low by November election standards (72% of the Gardens voted for President), it was near the top of the range for a March election. The record was reached in 2014 when 7085 turned out for the Jablin /Peragine race. To find another that surpassed this year’s turnout you need to go back to 2005 when 6400 voted in the Jablin / Sartory contest.
The runoff election will be held on March 28. Historically, turnout drastically declines in runoffs. The last March runoff election in the Gardens was in 2004 when David Levy defeated Carl Sabatello in Group 4. Although 6552 voted in the original contest, only 3850 showed up for the runoff. Mr. Levy got 74% – 2864 votes, which was down from the 2909 he got in the first race. Mr. Sabatello’s votes declined from about 1340 in the first contest to about 1000, so turnout (or lack thereof) can have dramatic results. Mr. Russo and Ms. Litt will have to keep their supporters focused to prevail in two weeks.
There was another runoff in 2004, when 6 candidates competed coincident to the August primary election in Group 1. Three times the August vote turned out in November, giving Hal Valeche a narrow victory over Jodie Barnett. It was the presidential election of course that drove that turnout.
Here are the results as reported by the Supervisor of election: