The PBG Budget and the Taxpayer Bill of Rights (TABOR)
September 4, 2017
The 2018 PBG Budget raises $4.1M in new taxes, up 7.4% over last year. See the Proposed Budget here.
Prior to the passage of the sales tax surcharge last year, PBG staff had said they didn’t need the money, and if passed, would return some to the taxpayers in a millage reduction. That all changed of course when the full 10 year revenue stream was captured in a bond and allocated to projects starting immediately, including $11M for a new park.
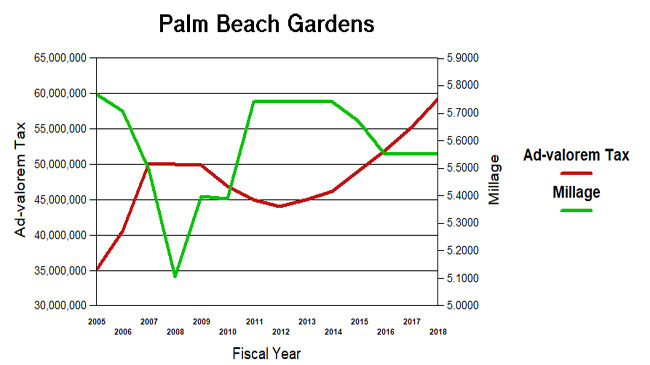
As the new budget is considered, so far only Vice Mayor Mark Marciano, following in the Bert Premuroso tradition, has suggested they consider a millage decrease. The rest, along with staff, plan to proceed for the third year with the millage rate set in 2016 at 5.55.
This millage will raise $59M in taxes, an increase of $4.1M over last year’s $55M, up 7.4%. (Note that we compare the budget figures, not the calculated “rollback rate” which overstates last year’s budget.) The sales surtax provides another $3M windfall each year.

Is this growth in taxes (and expenditures) justified by the growth of Palm Beach Gardens? How much taxation is enough?
In 1992, the state of Colorado amended their constitution to restrict the growth of taxation. Under the “Taxpayer Bill of Rights” (TABOR), state and local governments could not raise tax rates without voter approval and could not spend revenues collected under existing tax rates without voter approval if revenues grow faster than the rate of inflation and population growth. The results of this Colorado experiment are mixed, and TABOR has its pros and cons. (For background on TABOR, see: Taxpayer Bill of Rights ) Population growth and inflation though, would seem to be a way of assessing the appropriateness of the growth of a city budget, at least as an initial benchmark.
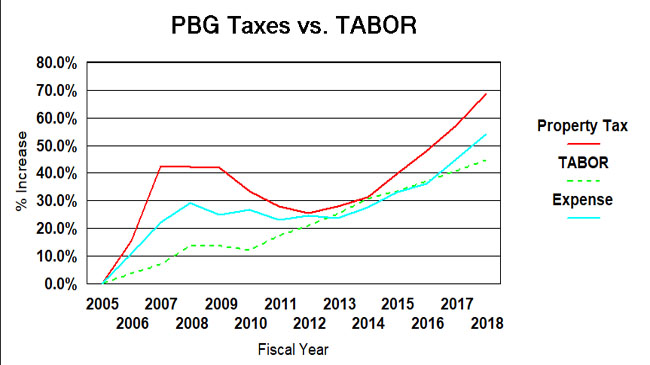
Since 2005, the population of Palm Beach Gardens has grown by about 14% to its current 55,637 (est.) Inflation, measured by the consumer price index, was 26%. Taken together, TABOR would suggest a growth in city spending and taxation of about 45%. (see graph below).
Over the same period, ad-valorem taxes grew 69% and total expenditures (budget less debt payment, capital and transfers) grew 54%. Both are above the TABOR line, but note that in 2013, reductions in tax collection had actually returned to the trendline. It is only since then that we seem to be off to the races.
It should be noted that ad-valorem taxes fund only a part of city expenditures, the rest made up from impact fees, fees for services, other taxes, intergovernmental grants, etc. and have varied from 66% of the total in 2005 to about 73% now. That is why taxes and expenses do not track each other on the chart.
So if you trust TABOR as a measuring stick, is this growth in taxation excessive? You be the judge.
